
Eagle Energy
Infrastructure Fund
An Award-Winning Fund

Best Fund over 10 Years
Energy MLP Funds
LSEG Lipper Fund Awards, ©2026 LSEG.
All rights reserved. Used under license.
Best Fund over 5 Years
Energy MLP Funds
LSEG Lipper Fund Awards, ©2024 LSEG.
All rights reserved. Used under license.

Best Fund over 3 Years
Energy MLP Funds
Refinitiv Lipper Fund Awards, ©2023 Refinitiv. All rights reserved. Used under license.
The LSEG Lipper Fund Awards, granted annually, highlight funds and fund companies that have excelled in delivering consistently strong risk-adjusted performance relative to their peers. The LSEG Lipper Fund Awards are based on the Lipper Leader for Consistent Return rating, which is a risk-adjusted performance measure calculated over 36, 60 and 120 months. The fund with the highest Lipper Leader for Consistent Return (Effective Return) value in each eligible classification wins the LSEG Lipper Fund Award. For more information, see lipperfundawards.com. Although LSEG makes reasonable efforts to ensure the accuracy and reliability of the data contained herein, the accuracy is not guaranteed by LSEG Lipper.
Fund Overview
The Fund seeks to generate an attractive total rate of return from high current income and long-term capital appreciation through investments in energy infrastructure securities and other related investments. The Fund intends to qualify as a Regulated Investment Company (RIC) and avoid the double taxation of many of the midstream-focused mutual funds currently available. It will also issue a single IRS Tax Form 1099. The Fund’s investment process favors investments that it believes can generate consistent distribution growth over time, which have strong management commitment and are reasonably valued based on expected growth and income. The Fund focuses on midstream energy infrastructure assets with “toll road” or fee-based business models with little or no direct commodity price exposure.
Objective
- The Fund seeks Income and Capital Appreciation
Investment Approach
- Focus on businesses that we believe can generate consistent distribution growth
- Stable, fee-based business models
- Reduced commodity price exposure
- Provide investors access to the Midstream Energy asset class through what we believe to be a diversified portfolio of energy infrastructure companies
- Preserve the tax benefits of midstream securities through low portfolio turnover and long-term gains
Organizational Structure
- 1940 Act registered open-end mutual fund
- Tickers: EGLIX, EGLAX, EGLCX, EGLNX
- Daily liquidity
- Form 1099 tax reporting
A Fund Designed For Investors Seeking:
Income
Tax Efficiency
Exposure to
Real Assets
Experienced Managment
About Energy Infrastructure
Energy infrastructure companies may have the ability to generate free cash flow, income and growth potential and can possibly add valuable diversification to portfolios. These companies may own and/or operate assets in the following industries:

Pipelines
Transportation of natural gas, natural gas liquids (NGLs), crude oil and refined petroleum products.

Liquified Natural Gas (LNG)
Converters of natural gas to LNG.
Proprietary Valuation Process
Step 1: Multi-Scenario Analysis
- Potential investments are analyzed, modeled and stress-tested under at least a base case, stress case and optimistic case scenario to determine their potential cash flow and yield.
Step 2: Cash Flow Matching
- Modeled projected cash flow and losses are compared with actual historical cash flows and losses to detect any potential weaknesses or errors in the industry standard Intex and Bloomberg models.
Step 3: Value Determination
- Overall attractiveness of a security is guided by a risk/reward equation that places a premium on minimizing potential downside.
- A bid range is established for each potential investment based on Deer Park’s cash flow adjusted multi-scenario analysis.
Security Selection
- The proprietary valuation process narrows the universe of securities to a small subset that meets Deer Park’s investment criteria.
- Typically looking for attractively priced bonds believed to have high cash flow, short duration, diversification across the MBS/ABS spectrum, high degree of optionality, i.e., the potential for additional upside gain, but minimal additional downside, seasoned (i.e., older) bonds with extensive payment histories.
Trading
Purchase
- The extensive experience of Deer Park’s investment team, and proprietary valuation process, enables fast turnaround when bids are solicited by dealers.
- Deer Park believes their process and methodology provide a competitive edge in the sourcing and trading of discounted fixed-income securities.
- Purchases and sales of all securities are executed at prices within pre-determined min/max price limits.
Trading
- Most securities are purchased under the assumption that they will be held to term.
- Adjustments made opportunistically and based on market conditions.
- Securities may be sold to:
- Take advantage of positive price movements
- Protect against negative price movements
- Rebalance the portfolio to achieve yield, cash flow and diversification targets
Portfolio Management/Monitoring
Management & Monitoring Process
- Each bond in the portfolio is re-evaluated using Deer Park’s valuation model on a monthly basis.
- Securities that have moved outside acceptable risk/reward parameters become candidates to be sold.
- Securities may also become sale candidates to re-balance the portfolio to achieve yield, cash flow and diversification targets.
- Interest rate sensitivity of the portfolio is monitored and modeled on a regular basis to determine the impact of rate changes across the yield curve:
- Typical portfolio construction minimizes the impact of changes in interest rates, however, the portfolio may be positioned to take advantage of rates moving either up or down.
- Portfolio management targets:
High annual cash flow*
Primary: Deeply discounted residential MBS (60 – 100% of the portfolio*)
Secondary: Deeply discounted other ABS such as - manufactured housing, autos, franchise, airplane, commercial real estate, REITs and/or credit default swaps (0 – 40% of the portfolio*)
Diversified portfolio with holdings typically between 1.5 – 5% of portfolio
*The cash flow target is dependent on market conditions and may or may not be achieved, and is not guaranteed.

Gathering & Processing
Gathering of oil, natural gas and NGLs from the well head, and the processing of natural gas and NGLs.

Storage
Storage of natural gas, NGLs, crude oil and refined petroleum products.
Risk Management
Portfolio Risk Mitigation
- Diversification within ABS market and security type. Deer Park believes that trading a broad universe of ABS, as opposed to small sub-segment, reduces risk and increases returns over the long-term.
- Focus on short-term securities. Targeting a portfolio effective duration that is typically 2-6 years to manage pricing volatility and interest rate risk.
- Focus on securities with high current cash-flow. Targeting high portfolio cash flow provides liquidity throughout market cycles and attempts to reduce portfolio risk and volatility.
- Focus on deeply discounted securities. Deer Park’s deep-discount philosophy dictates that only securities viewed as undervalued are bought. This approach attempts to reduce downside risk to the portfolio.
- Hedging market risks through security selection. The enormous size of the MBS/ABS market and the wide variety of securities available allows Deer Park to hedge various market risks through the security selection and overall security composition of the portfolio.
- In-house credit risk modeling. Deer Park utilizes a bottom-up approach when valuing and analyzing each security.
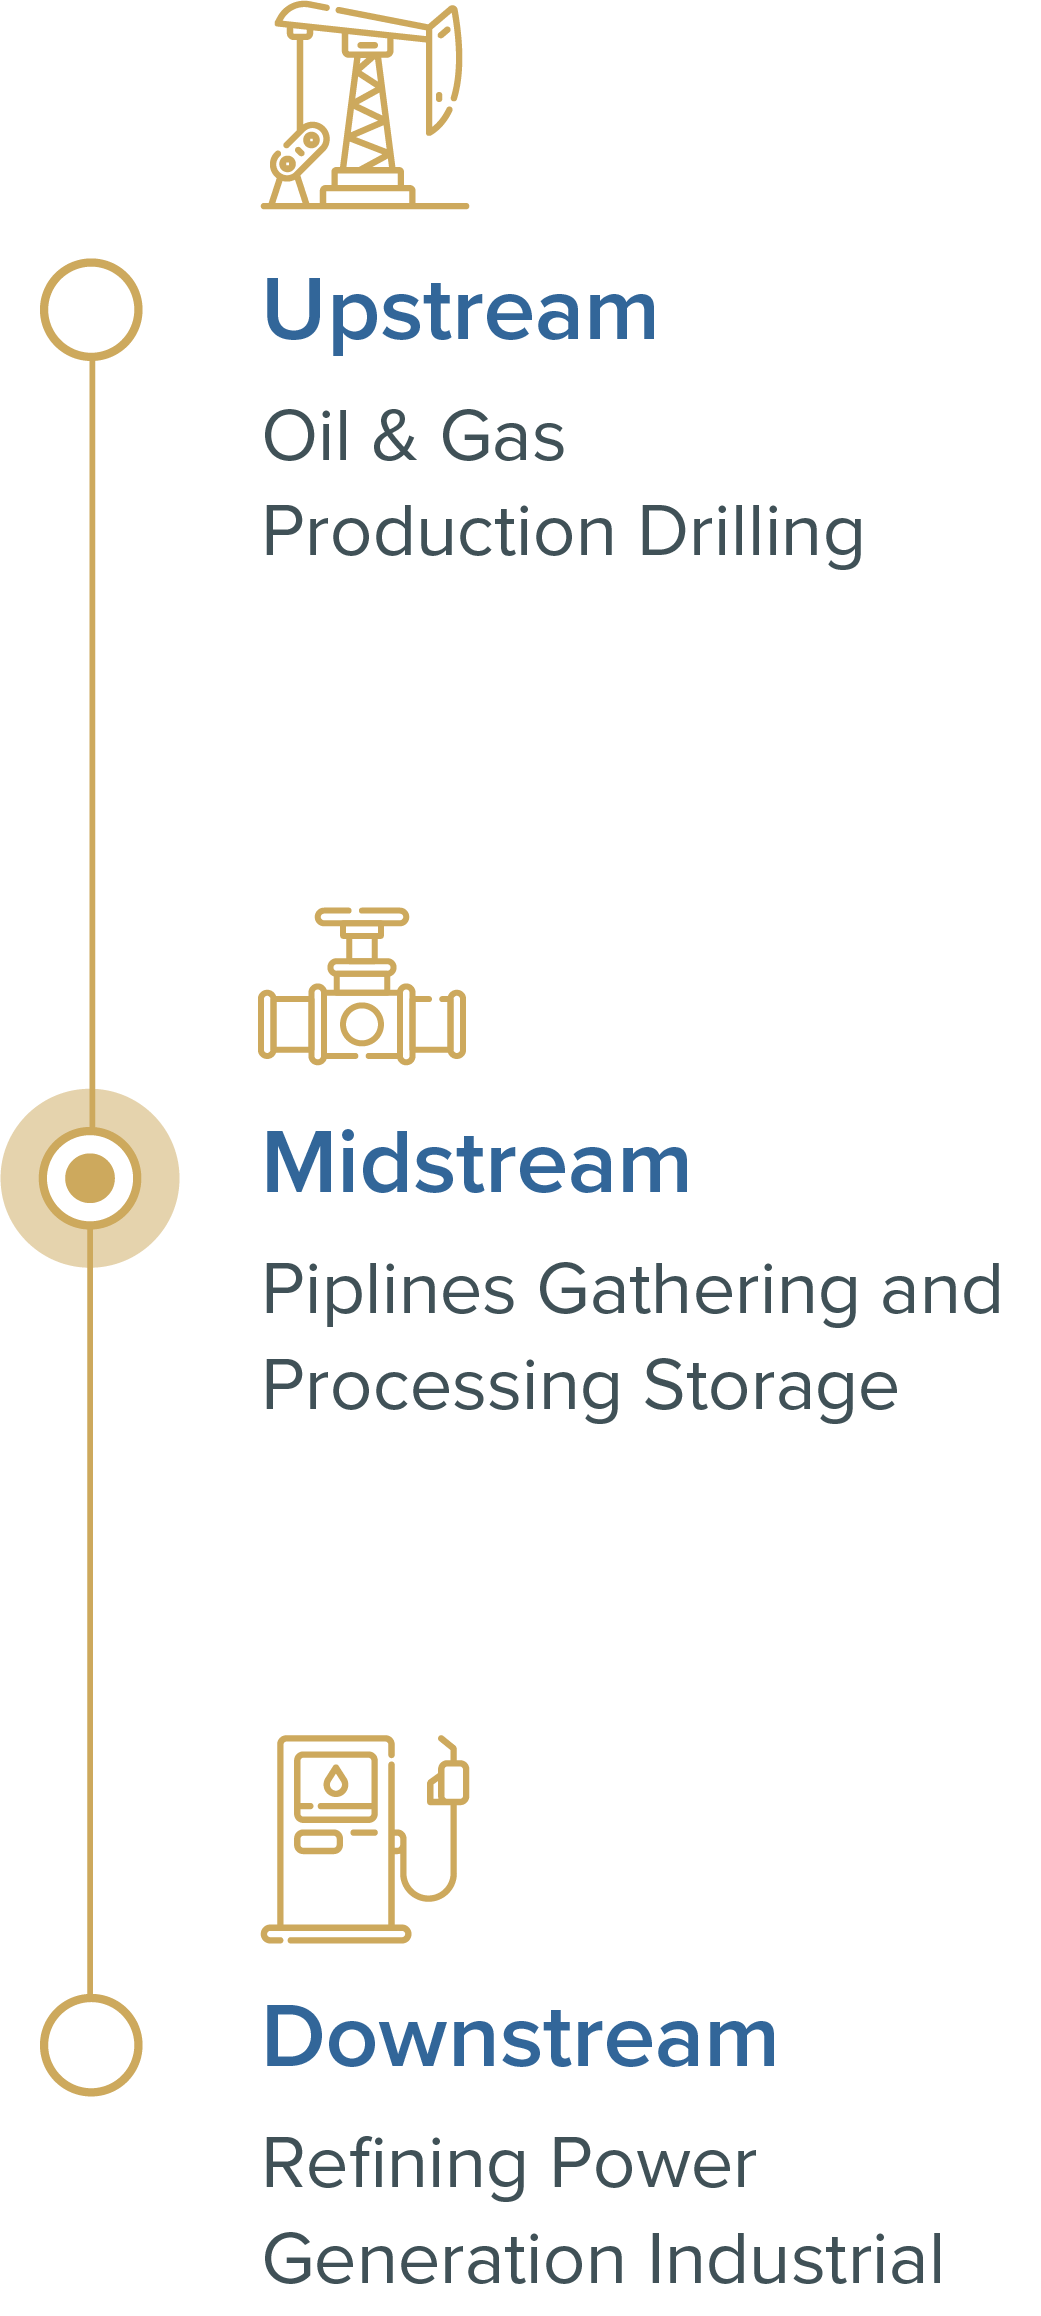
The Energy Supply Chain
Energy Infrastructure is broadly categorized in three segments:
Upstream, Midstream and Downstream. The Fund focuses primarily on Midstream.

Tax Efficiency
Benefits of RIC Tax Status
Mutual funds that fail to qualify as a Regulated Investment Company (“RIC”) are taxed as a corporation at a rate of up to 21%. One requirement for qualifying as a RIC is that a mutual fund my not invest more than 25% of assets in publicly-traded partnerships, including MLPs.

The Eagle Energy Infrastructure Fund has maintained its RIC tax status by investing in less than 25% publicly traded partnerships and the balance in midstream C-Corps.
For illustrative purposes only.
The data shown above does not reflect an actual investment.
Performance
| Fund Prices & YTD Returns as of 11/5/2026 | Performance Through 11/5/2026 | Average Annual Returns Through 9/30/2026 | ||||||||||
|---|---|---|---|---|---|---|---|---|---|---|---|---|
| Eagle Energy Infrastructure Fund Class A Shares | ||||||||||||
| NAV | NAV Daily Change | % Daily Change(1) | % YTD Return(2) | One Month | Three Months | Six Months | Since Inception(4) | One Year | Three Years | Five Years | Ten Years | Since Inception(4) |
| 11.89 | -0.34 | -2.78% | 20.09% | -4.69% | -4.99% | -6.56% | 7.14% | 23.08% | 23.64% | 23.10% | 10.19% | 7.31% |
| With Sales Charge(3) | -10.18% | -10.45% | -11.92% | 6.69% | 16.04% | 21.20% | 21.65% | 9.54% | 6.86% | |||
| Eagle Energy Infrastructure Fund Class I Shares | ||||||||||||
| NAV | NAV Daily Change | % Daily Change(1) | % YTD Return(2) | One Month | Three Months | Six Months | Since Inception(4) | One Year | Three Years | Five Years | Ten Years | Since Inception(4) |
| 11.90 | -0.34 | -2.78% | 20.36% | -4.70% | -4.86% | -6.44% | 7.40% | 23.36% | 23.97% | 23.42% | 10.45% | 7.58% |
| Eagle Energy Infrastructure Fund Class C Shares | ||||||||||||
| NAV | NAV Daily Change | % Daily Change(1) | % YTD Return(2) | One Month | Three Months | Six Months | Since Inception(4) | One Year | Three Years | Five Years | Ten Years | Since Inception(4) |
| 11.84 | -0.35 | -2.87% | 19.21% | -4.81% | -5.19% | -6.99% | 5.82% | 22.07% | 22.71% | 22.19% | 9.37% | 6.00% |
| Index Performance | ||||||||||||
| Alerian MLP Index TR | — | -2.45% | 15.15% | -6.58% | -8.07% | -5.51% | 6.19% | 25.27% | 20.05% | 22.39% | 9.28% | 6.59% |
(1) Represents the percentage increase/decrease in the net asset value from the prior trading day.
(2) Performance for periods less than one year is not annualized.
(3) The maximum sales charge for Class A Shares is 5.75%. Class A Share investors may be eligible for a reduction in sales charges
(4) Inception date for class I and A shares was 9/14/12. Inception date for class C share was 2/21/13. Inception date for class N share was 8/16/18. Since Inception data shown for the Alerian MLP Index begins on 9/14/2012.
The performance data quoted here represents past performance. Current performance may be lower or higher than the performance data quoted above. Investment return and principal value will fluctuate, so that shares, when redeemed, may be worth more or less than their original cost. Past performance is no guarantee of future results. For performance information current to the most recent month end, please call toll-free 1-888-868-9501.
The total annual fund operating expenses are Class A 1.90%, Class C 2.65%, and Class I 1.65%. The Fund’s investment advisor has contractually agreed to reduce its fees and/or absorb expenses of the Fund, at least until August 31, 2027. Total annual operating expenses after fee waiver are Class A 1.65%, Class C 2.40%, and Class I 1.40%. The maximum sales load for Class A is 5.75%. Please review the Fund’s Prospectus for more detail on the expense waiver. Results shown reflect the waiver, without which the results could have been lower. A Fund’s performance, especially for very short periods of time, should not be the sole factor in making your investment decisions.
The index shown is for informational purposes only and is not reflective of any investment. An investor cannot invest directly in an index. Indices do not include fees or operating expenses and are not available for actual investment. They are unmanaged and shown for illustrative purposes only. The Alerian MLP Index (NYSE: AMZ) is a composite index of the 50 most prominent energy master limited partnerships.
Management
Co-Adviser

Princeton Fund Advisors, LLC together with its affiliates, manages approximately $11.3 billion of assets for institutional and private clients worldwide (As of 6/30/2026). Princeton Fund Advisors, LLC is a Registered Investment Advisor ("RIA") with the SEC. The firm's three Investment Committee Members contribute more than 60 years of alternative asset management experience to the portfolio construction and management process. The Company has offices in Colorado and Minnesota. Princeton Fund Advisors, LLC serves as Co-Advisor to the Fund.
Co-Adviser

Eagle Global Advisors, LLC was founded in 1996 and located in Houston, TX, the knowledge center for both Energy and MLPs. Eagle is an SEC registered investment advisor and manages approximately $3.2 billion (as of 6/30/2026) of assets comprised of public funds, hedge funds and separately managed accounts. Eagle's experienced investment team has over 50 years of direct MLP investment experience. Eagle Global Advisors serves as Co-Advisor to the Fund.

Alex Meier Co-Portfolio Manager
Alex serves as Co-Head of the energy infrastructure team and Co-Chair of the energy infrastructure investment committee. Prior to joining the Eagle investment team in 2013, he served for 11 years as an energy portfolio manager and analyst at Waterfront Capital and Zimmer Lucas focusing on E&P, MLP, and utility securities.

Michael Cerasoli, CFA Co-Portfolio Manager
Michael serves as Co-Head of the energy infrastructure team and Co-Chair of the energy infrastructure investment committee. Prior to joining Eagle in 2014 Michael was employed by Goldman, Sachs & Co. for ten years where he covered MLPs for seven years and small/mid cap Oil Services for three.
Fund Facts
| Share Class | Ticker | CUSIP | Investment Minimum* | AIP/AWP & Subsequent Minimum | Redemption Fee | Gross Expense Ratio | Net Expense Ratio | Class Structure | 12B-1 Fee | Inception Date |
|---|---|---|---|---|---|---|---|---|---|---|
| A Share | EGLAX | 66537Y322 | $2,500 | $100 | NONE | 1.97% | 1.65% | 5.75% Load* | 0.25% | 9/14/2012 |
| I Share | EGLIX | 66537Y314 | $100,000 | $100 | NONE | 1.72% | 1.40% | No Load | None | 9/14/2012 |
| C Share | EGLCX | 66537Y249 | $2,500 | $100 | NONE | 2.72% | 2.40% | No Load | 1.00% | 2/21/2013 |
| N Share | EGLNX | 66539A736 | $10,000,000 | $100 | NONE | 1.72% | 1.26% | No Load | None | 8/16/2018 |
| Role | Organization |
|---|---|
| Co-Investment Advisor | Eagle Global Advisors, LLC |
| Co-Investment Advisor | Princeton Fund Advisors, LLC |
| Independent Auditor | RSM US LLP |
| Outside Counsel | Thompson Hine LLP |
| Custodian | U.S. Bank |
| Distributor | Northern Lights Distributors, LLC |
*The load and investment minimum may be waived at the discretion of the advisor.
Documents
Regulatory Documents:
- Prospectus
- Statement of Additional Information (SAI)
- EGLAX 2025 Semiannual Report
- EGLAX 2026 Annual Report
- EGLCX 2025 Semiannual Report
- EGLCX 2026 Annual Report
- EGLIX 2025 Semiannual Report
- EGLIX 2026 Annual Report
- EGLNX 2025 Semiannual Report
- EGLNX 2026 Annual Report
- Portfolio of Investments January 2026
- Portfolio of Investments July 2026
- 2026 Annual Financial Statements & Other Important Information
- 2025 Semi-Annual Financial Statements & Other Important Information